UB Tools with Mesolite Data#
This tutorial demonstrates how to use the UB tools in NeuXtalViz to process MANDI Mesolite data (chemical formula \(\mathrm{Na_2Ca_2Al_6Si_9O_{30}\cdot 8H_2O}\)).
Step 1: Convert to Q#
In the Convert to Q tab:
Select the MANDI instrument.
Enter the IPTS and run numbers for the Mesolite dataset.
Set the minimum d-spacing and wavelength range as appropriate.
Provide the MANDI calibration file if needed.
Click Convert to Q to load the data and build the Q volume.
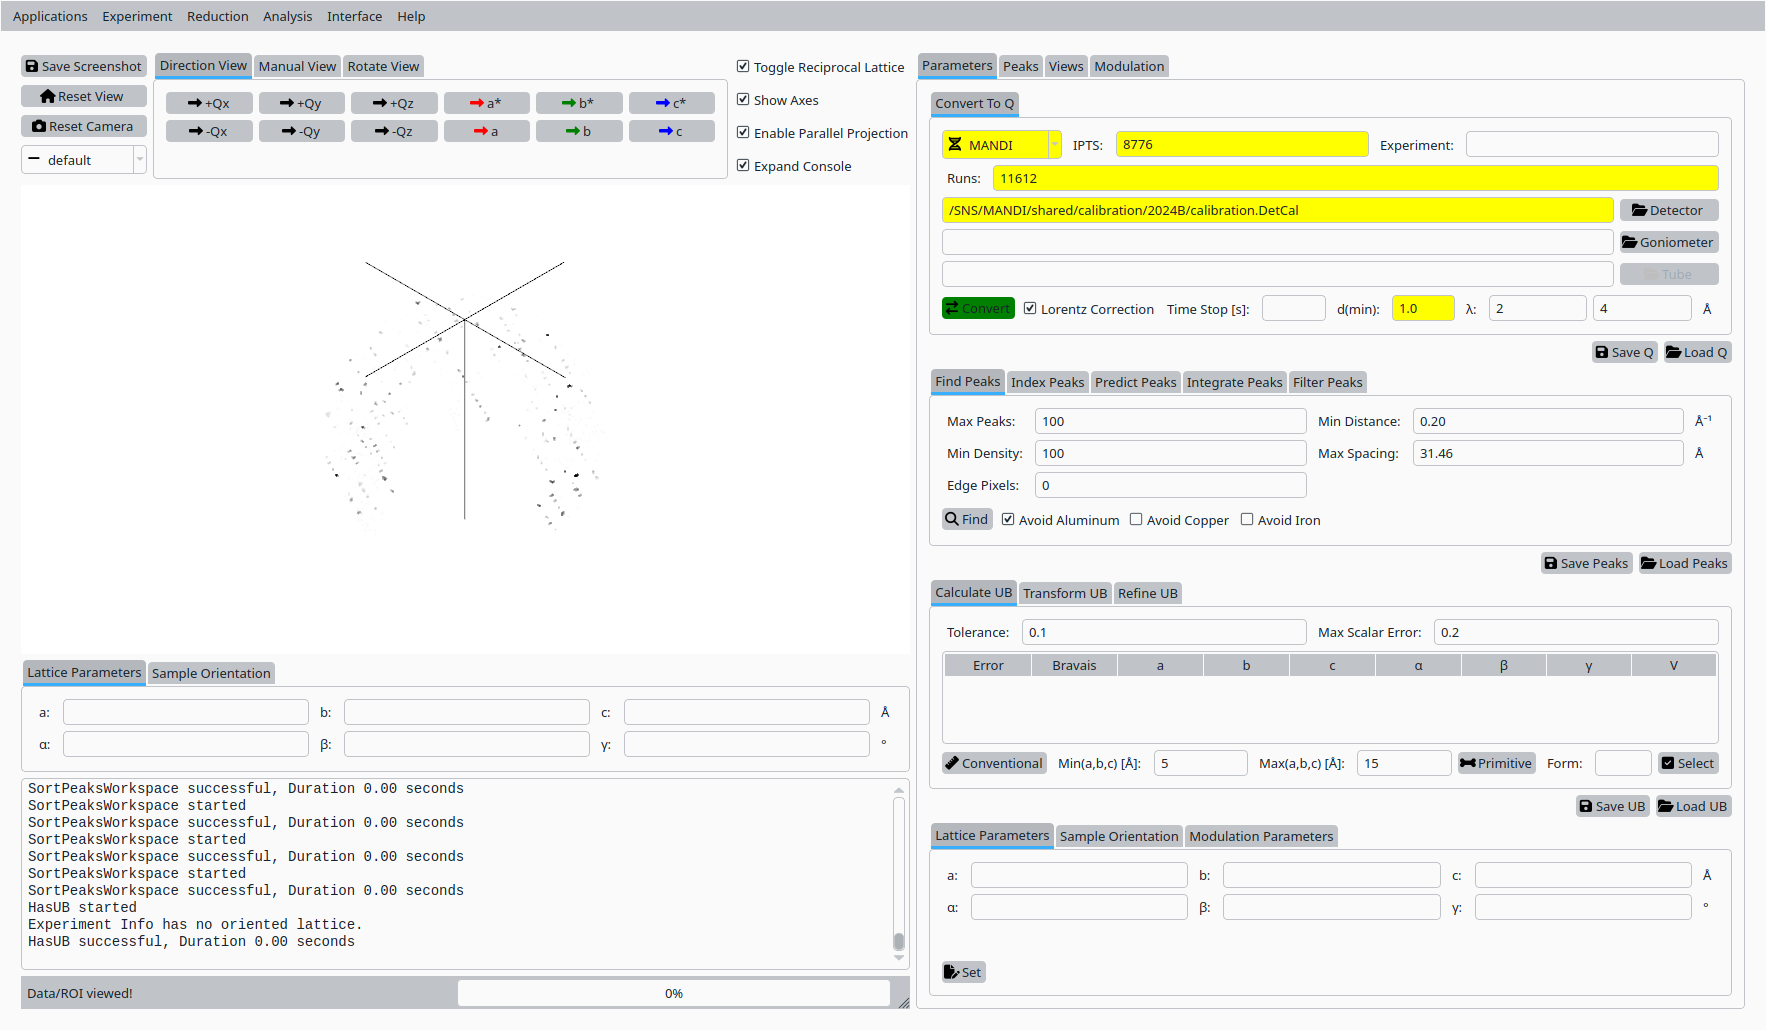
Convert Mesolite data to Q for MANDI.#
Step 2: Find peaks#
Still in the Convert to Q tab:
Adjust the peak-finding parameters (maximum number of peaks, density threshold, minimum distance).
Click Find Peaks to locate Bragg peaks in the Q volume.

Find Bragg peaks in the Mesolite Q volume.#
Step 3: Conventional cell#
In the UB tab:
Enter approximate lattice parameters for Mesolite.
Click Conventional Cell (or the corresponding button) to set up the initial unit cell based on these values.
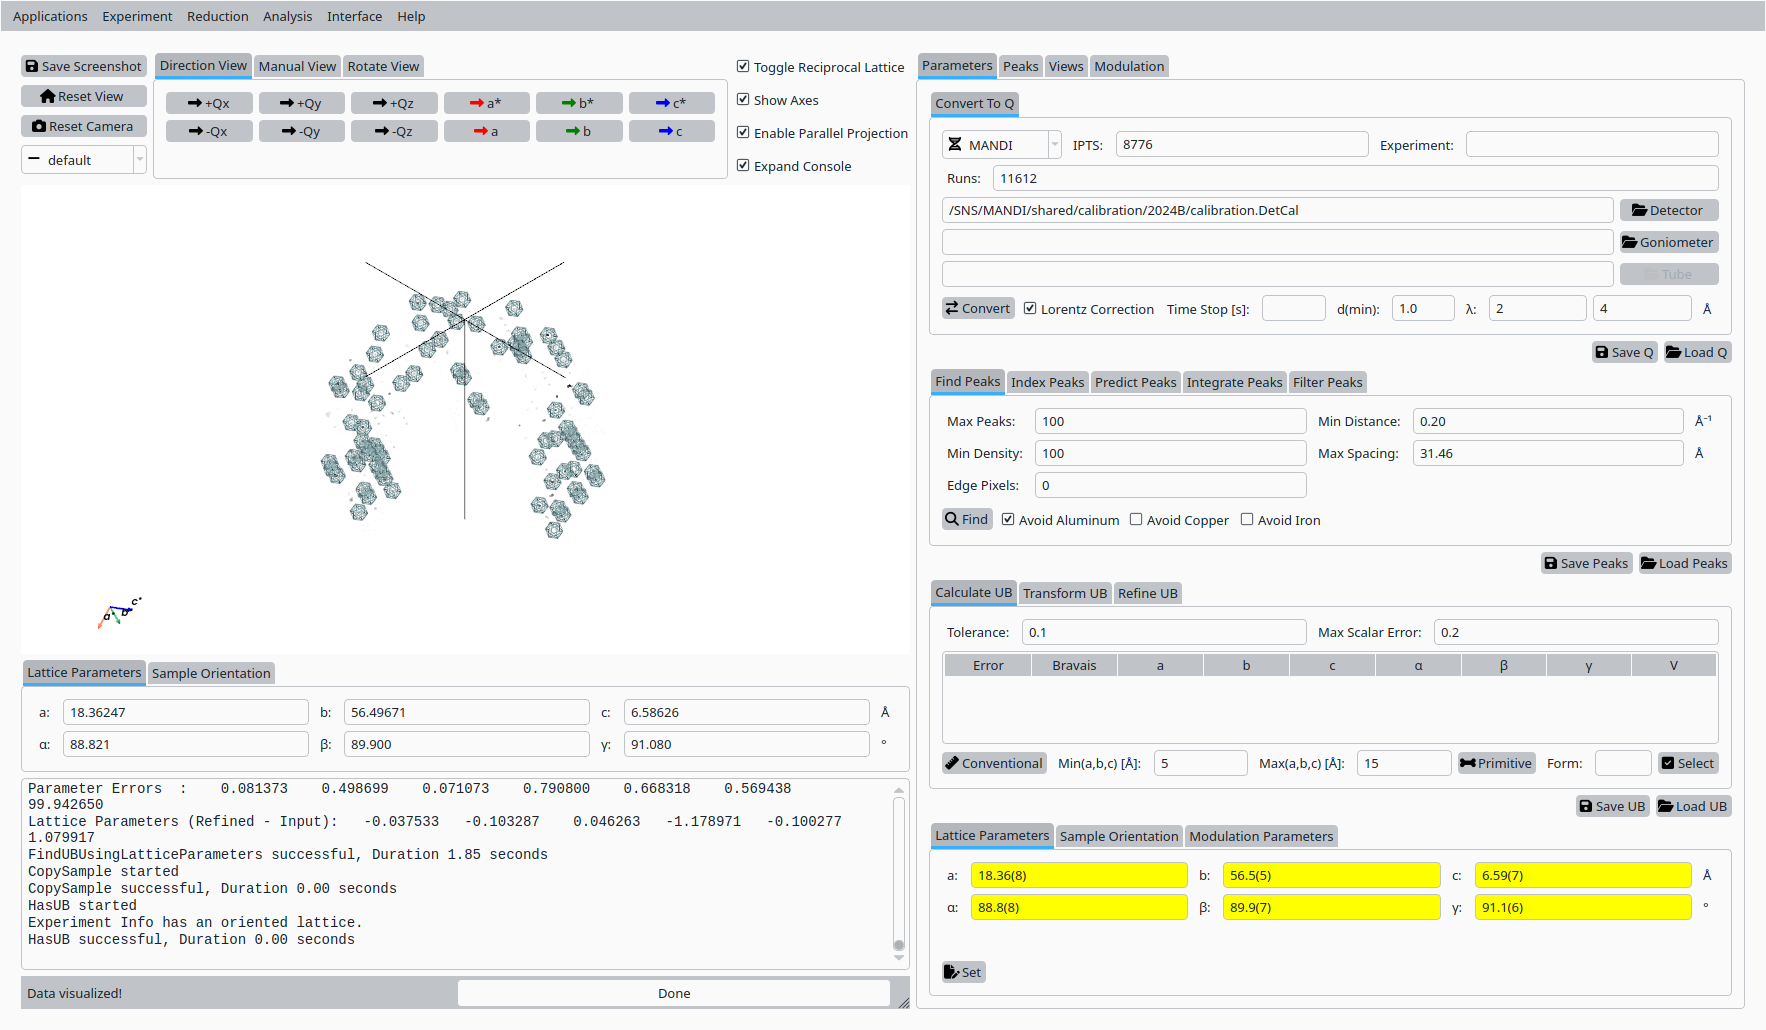
Conventional cell for Mesolite on MANDI.#
Step 4: Index peaks#
In the Peaks tab:
Switch to the indexing sub-tab.
Click Index Peaks to index the peak list using the current UB and cell parameters.

Indexing Mesolite peaks on MANDI.#
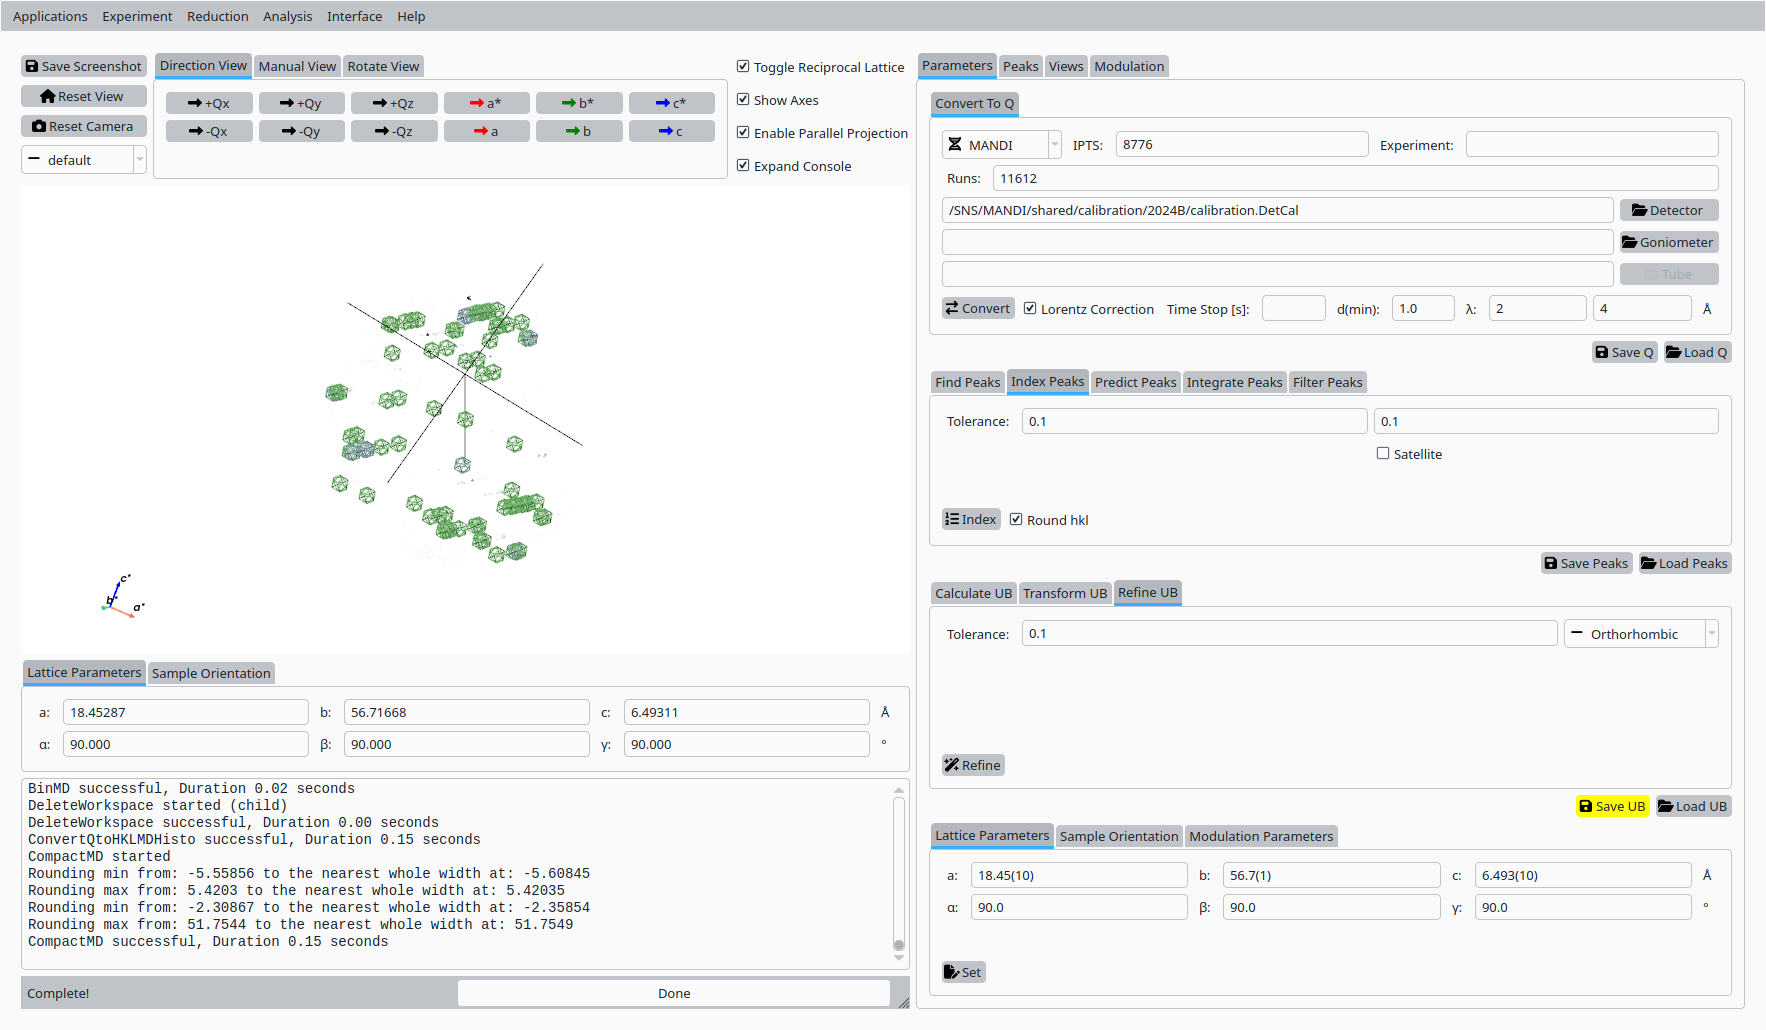
Step 5: Refine UB matrix#
Back in the UB tab:
Choose an optimization mode (for example, Orthorhombic).
Click Refine UB to refine the UB matrix against the indexed peaks.
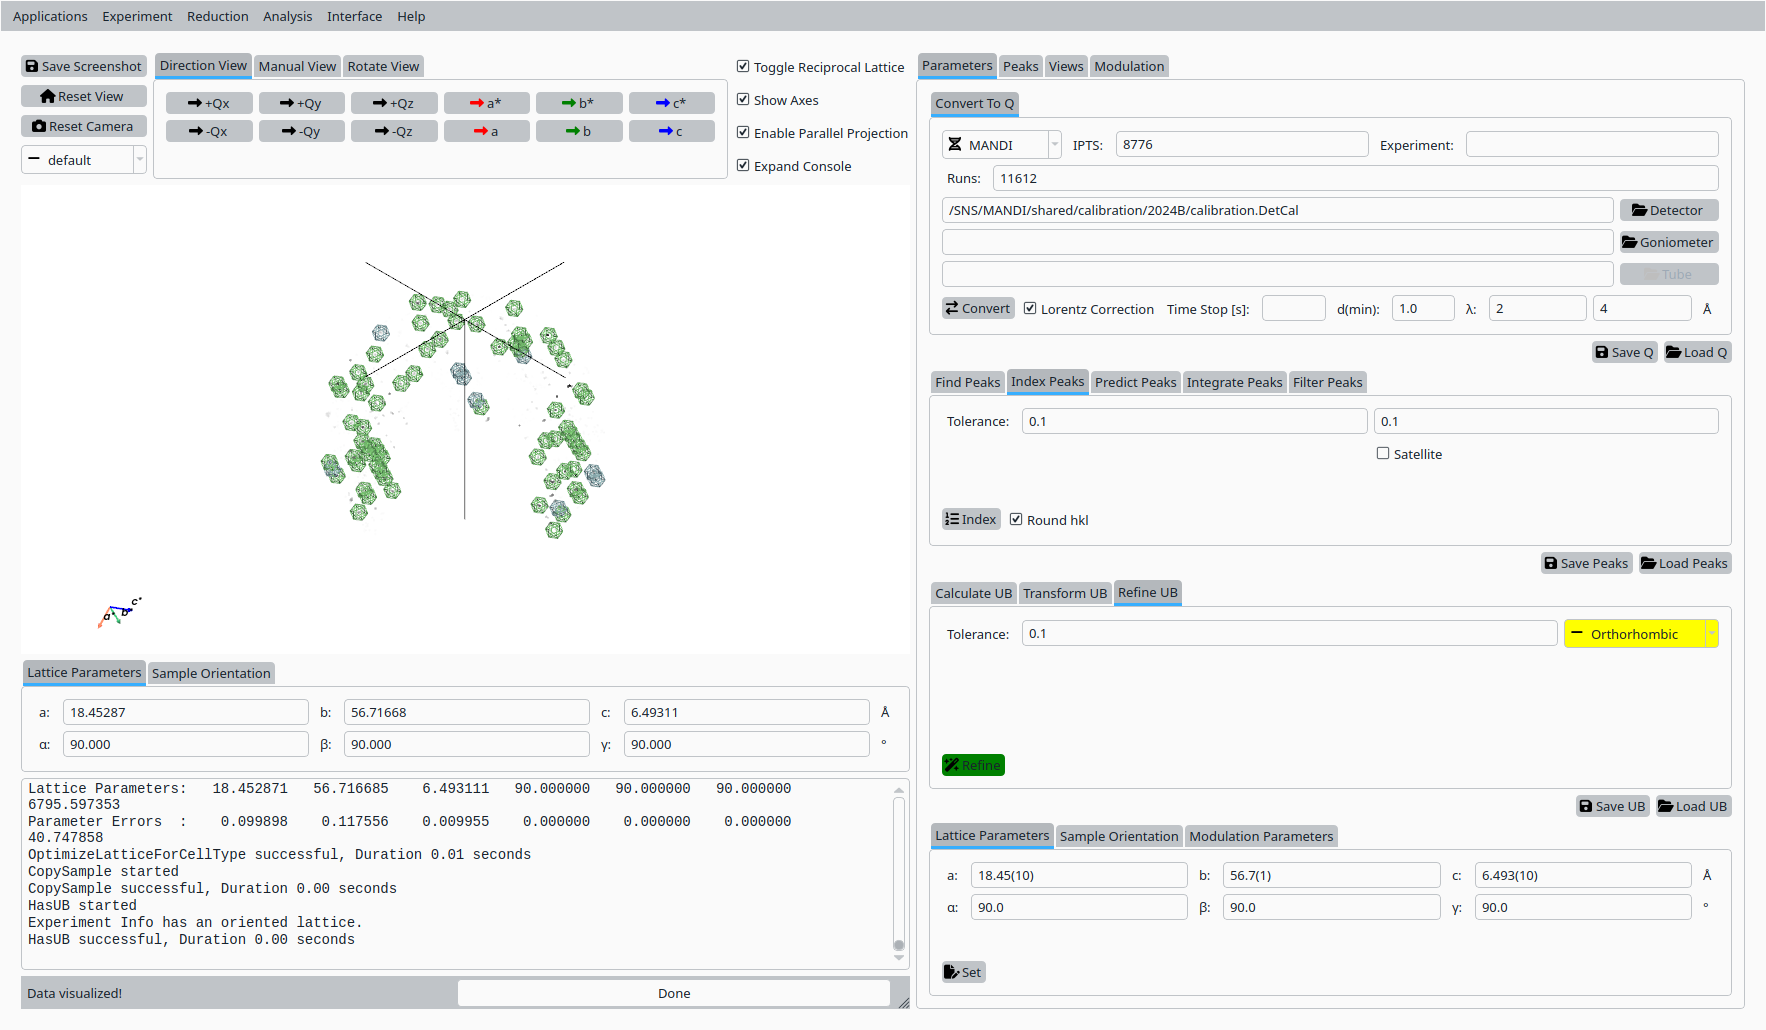
Refined UB matrix for Mesolite.#
Step 6: View indexed peaks#
In the Peaks tab:
Select a peak in the table to highlight it in the Q-space view.
Inspect the indexing and fit quality.
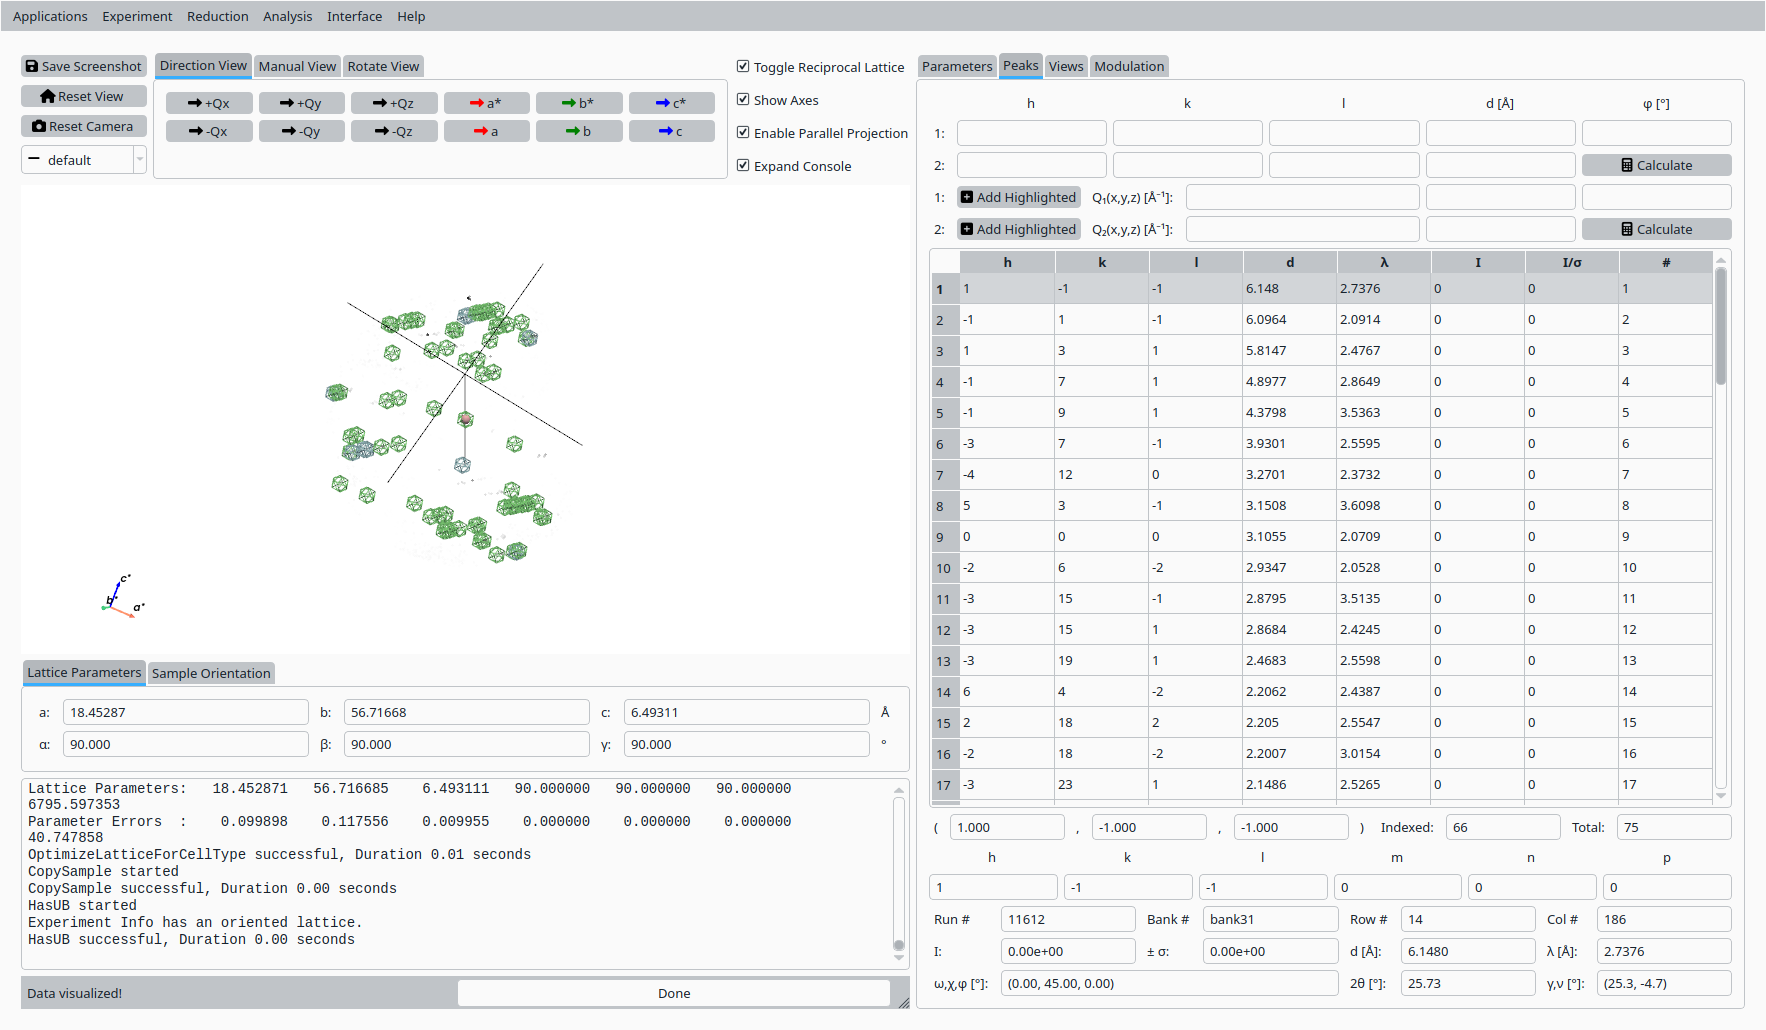
View and inspect an indexed peak for Mesolite.#
Step 7: HKL slice view#
In the Convert to HKL tab:
Choose a slice direction and coordinate.
Click Convert to HKL to generate a reciprocal-space slice.
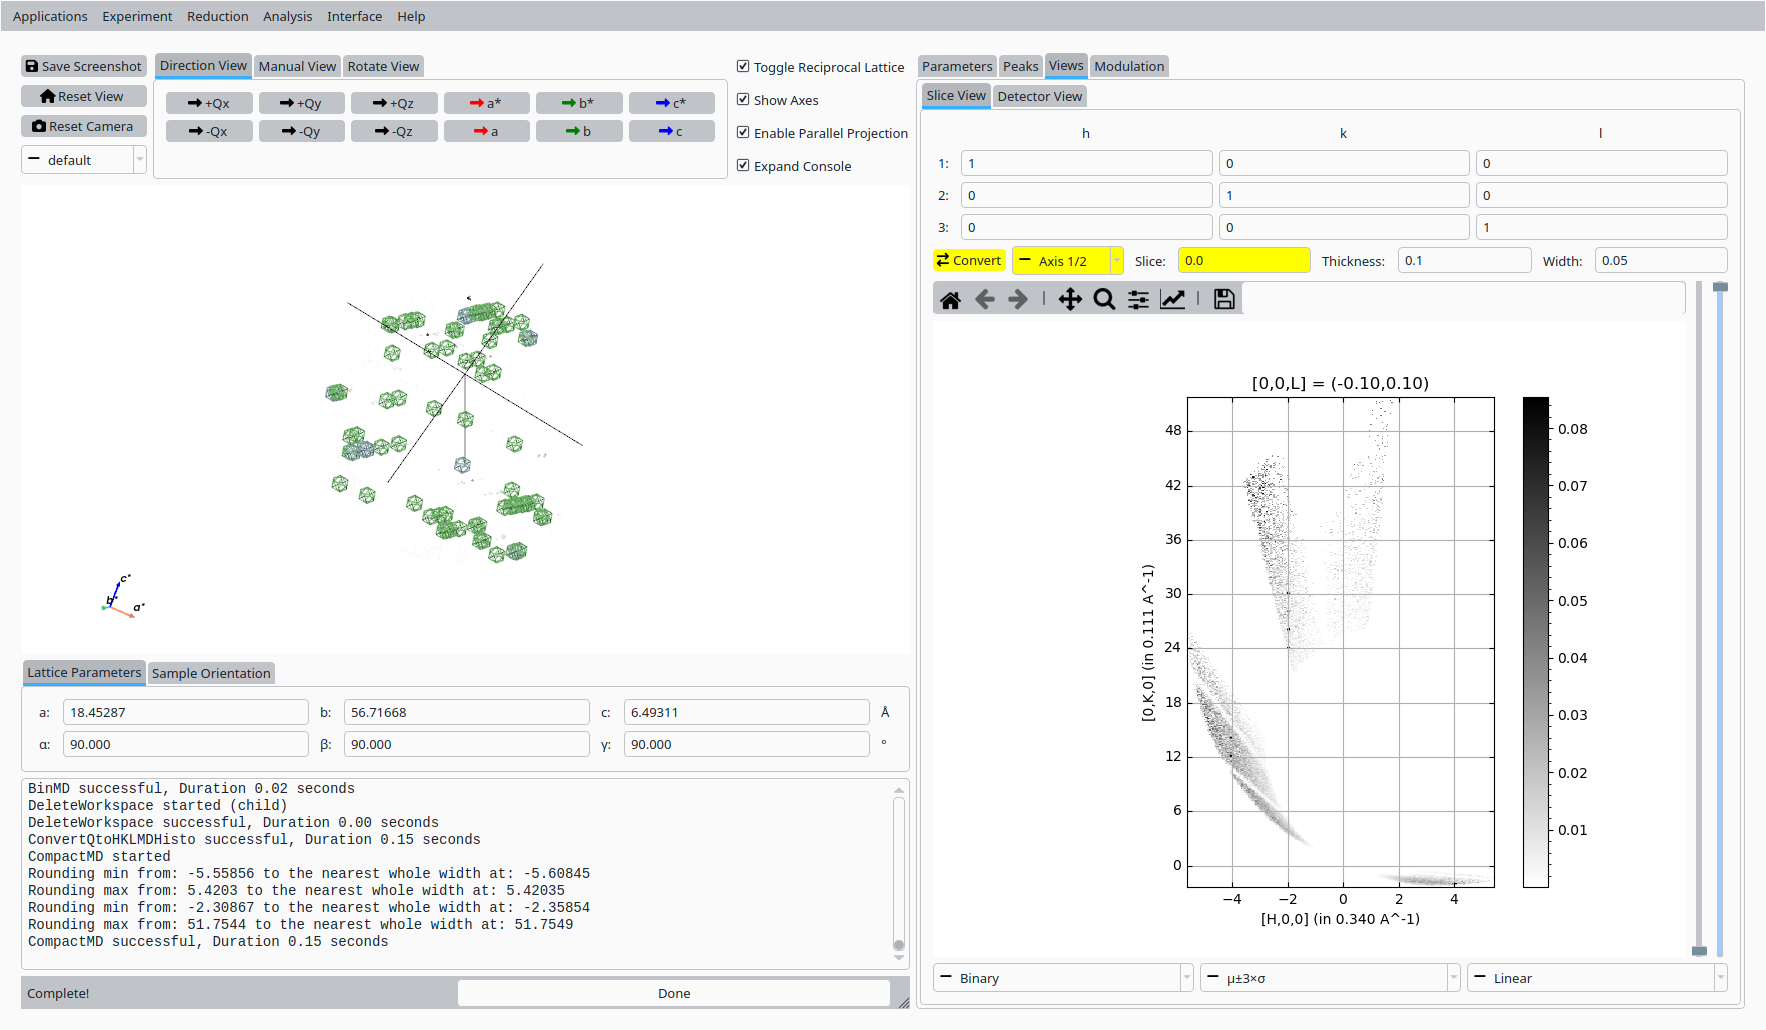
HKL slice view for the refined UB.#
Step 8: Save UB#
Back in the Convert to Q tab:
Click Save UB to write the refined UB matrix to disk for use in subsequent analysis.
Save the refined UB matrix for Mesolite.#